You can check all domains for AC agents, and policy application status of AC. Furthermore, you can also check connection status by product, settings status, and current trend & status of blocks.
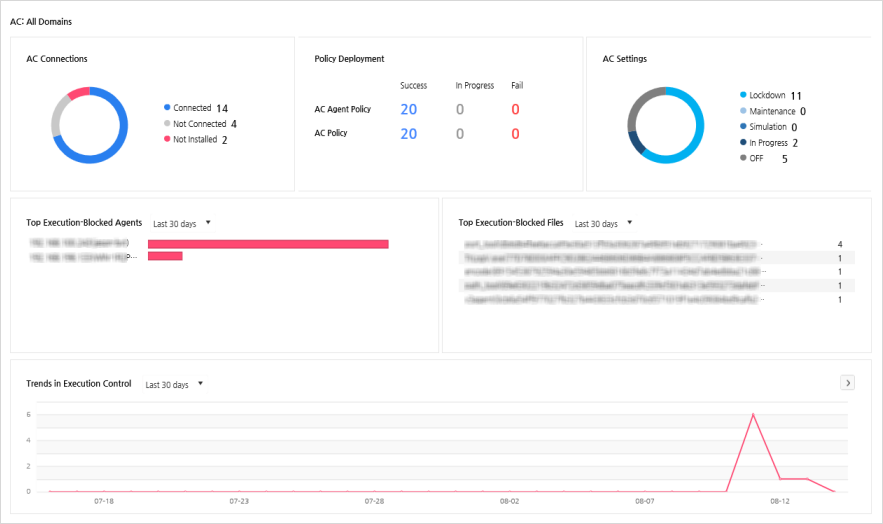
Displays AC Connections, Policy Overview, AC Settings, Top Execution-Blocked Agents, Top Firewall-Blocked IPs, and Trends in Execution Control for all domains. Policy Overview displays AC Agent Policy sent by the server and the number of agents based on AC policy's status (Applied/In Progress/Not Applied).
Displays connection status of Application Control (AC) and agent. Displays Connected/Not Connected/Not Installed depending on the connection status. If the AC and the agent are connected, Connected will be displayed. If not, Not Connected will be displayed. If the agent is not installed, Not Installed will be displayed. To check the details of the agent for each connection status, click the number of connection status and go to Management > Agent Status > AC Info.
Displays application status of AC agent and AC policy sent by the server. Depending on the application status, the policy will be displayed as Applied/In Progress/Not Applied. If the policy is applied, Applied will be displayed. If the application is in progress, In Progress will be displayed. If the policy is not applied, Not Applied will be displayed.
Displays the AC settings status of an agent. Lockdown/Maintenance/Simulation/Collecting/OFF will be displayed depending on the settings. If the agent is using AC feature (ON), Lockdown, Maintenance, Simulation, or Collecting will be displayed depending on the application control's mode. If not, OFF will be displayed. To check the details of the agent for each settings status, click the number of settings status and go to Management > Agent Status > AC Info.
Displays the ranking of agents by the number of file execution blocks. The agents with the highest number of blocks will be located on the top, and the agent's IP address will also be displayed. Click the IP address to move to Management > Agent > Execution Control Event and check detailed info.
Displays the ranking of files by the number of file execution blocks. The files with the highest number of blocks will be located on the top, and the name and hash value (SHA 256) of the file will also be displayed. Click the name of the file or number of blocks to move to Management > Agent > Execution Control Event and check detailed info.
Displays number of execution blocks for a file by time. Click ![]() to move to Log
> Agent > Execution Control Event and check detailed info.
to move to Log
> Agent > Execution Control Event and check detailed info.