On-Demand Scan
An on-demand scan allows scanning a process selected
from agent logs and checking process activities in the process tree even
when the processes are not malicious or suspicious.
You can view the following information from the on-demand scan:
- Check a process
for the on-demand scan request.
- Check the time
for the on-demand scan start time/end time.
 Note
Note
Select the search period from the right side of the On-Demand
page; Last 24 hours, last 48 hours,
last 7 days, last 14 days, last 30 days, and user-defined. When the option
for user-defined is selected, click the calendar( )
to specify the date and then click the clock(
)
to specify the date and then click the clock( ) to
specify the time.
) to
specify the time.
On-Demand Scan List
You can view the detailed scan information for the files where the on-demand
scan has been run from the on-demand scan list. You can view the on-demand
scan details as follows:
- Select Response
at the top of the screen.
- Select the On-Demand
tab.
- View the on-demand scan list. Click the scan
result to display the detailed behavior information about the on-demand
scan request process. You can run a command for the on-demand scan
from the column for process information in Log
> Agent EDR History.
- Status: Select an individual process status
for the on-demand scan from the list to view the details. If you want
to check the status even when the scan is not completed yet, click
pending. If you want to check the status
when the scan is completed, click Completed.
You can also enter a search keyword for a status to search for the
required information only.
- Delete: Deletes the selected item. Click the
required item to delete and then click Delete(
 )
at the left side of the screen, or click Delete
at the top of the list.
)
at the left side of the screen, or click Delete
at the top of the list.
- Total: Displays the total number of the files
checked by on-demand scan.
- View scan
results(
 ): Displays the details of the process,
which the on-demand scan request, using the process tree. You can
view the process behaviors in the process tree. If there is no on-demand
scan result, N/A(
): Displays the details of the process,
which the on-demand scan request, using the process tree. You can
view the process behaviors in the process tree. If there is no on-demand
scan result, N/A( )
will be displayed.
)
will be displayed.
- Detailed Scan Info: Displays the detailed information
about the on-demand scan request process.
- File Name: Displays a file name where the on-demand
scan was requested to run.
- File Hash Value: Indicates a hash value of
a file where the on-demand scan was requested to run.
- File Size (bytes): Indicates the size of a
file where the on-demand scan was requested to run.
- Agent IP Address: Displays an agent IP address
where the on-demand scan was requested to run.
- Administrator ID: Indicates an administrator
account where the on-demand scan was requested to run.
- Start Time: Indicates the start time for on-demand
scan.
- End Time: Indicates the end time for on-demand
scan.
Note
You can select a process in Log > EDR History to run
the on-demand scan command in a specific
agent.
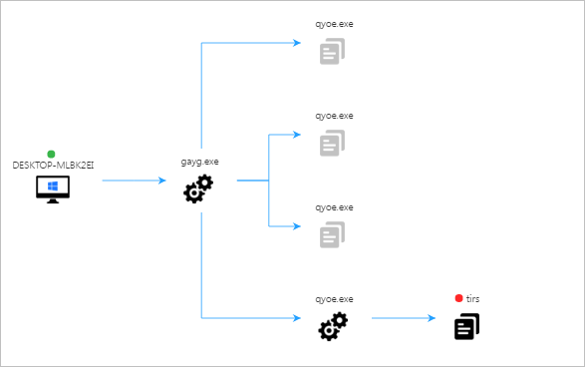
Process Tree
The process tree visually shows the relation between
process execution and suspicious behavior in three different types of
tree structure. Process Tree shows the additional behaviors as well as
V3 engine detections. The additional behavior information is shown in
gray. Click the system, file, process or registry from the process tree
to view the details.
Configuration for Process Tree
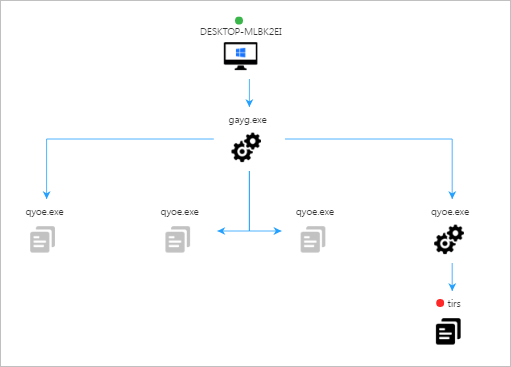
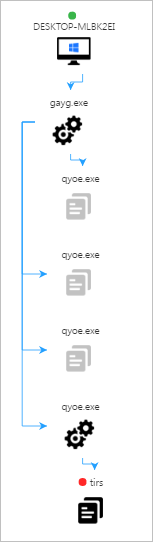
- Display Settings: You can have three different
types of display such as Expanding from left
to right, dropping down (wide) and dropping down (narrow).
Refer to Display Settings for Process
Tree for details about tree configuration.
- Expand/Collapse: You can expand
or collapse the tree structure using
the required menu.
- Icons: The icons used in the process tree indicate
the following information:
- Process
(
 ): Displays a behavior for a process
in the process tree.
): Displays a behavior for a process
in the process tree.
- File
(
 ): Displays a behavior for a file in
the process tree.
): Displays a behavior for a file in
the process tree.
- Network(
 ):
Displays a behavior for the network in the process tree.
):
Displays a behavior for the network in the process tree.
- Registry
(
 ): Displays a behavior for the registry
in the process tree.
): Displays a behavior for the registry
in the process tree.
Agent System
Click the system icon in the tree process to display the information
for the detected agent information in the right side of the page. You
can run commands such as completely network
intrusion prevention, collecting AhnReport and artifact to respond to
the detected systems.
Click the icon ( )
next to a system name to move to Detection >
Agent.
)
next to a system name to move to Detection >
Agent.
- Respond: You can run commands such as network intrusion prevention,
collecting AhnReport
and artifact to respond to the detected agent systems.
- Block Network: Runs a command to completely
block the network connection for the detected agent systems. The agent
system, which received the network block command will be blocked for
network access. If the V3 personal firewall is enabled in agent systems,
the network block command can be run in real-time. Network intrusion
prevention blocks the spread of malicious codes until a root cause
for the abnormal network traffic is found. If it is concluded that
there is no agent system issue, the network
block can be disabled.
- Collect AhnReport: Runs a command to collect
AhnReport for the detected agent systems. AhnReport collects the information
from the file, registry, system, network, hardware, installed program
and timeline. If a command for collecting AhnReport is run, the timeout
settings can be configured. For example, if the timeout is specified
for 20 minutes and there is no agent response for 20 minutes, it will
be determined that the command is not properly delivered.
- Collect Artifact: Runs a command to collect
Artifact for the detected agent systems. Collects the traces created
by using the operating system or application from Collect Artifact.
Also collects the logs, history, timeline and registry information.
View the details for collecting artifact in Collect
Artifact.
- Default
items: Collects the default items from EAC (Endpoint Artifacts
Collector). Also collects the process, system, network, hardware,
program, timeline, etc for the default items.
- User-defined
items: Collects the required
artifact only by writing the YAML syntax.
Refer to Collecting
User-Defined Artifact for writing the YAML syntax.
- Computer Name: Displays a computer name of a
detected agent system.
- IP Address: Displays an IP address of a detected
agent system.
- Operating System: Displays an operating system
of a detected agent system.
- V3 Product: Displays the V3 program installed
in a detected agent system.
- Engine Version: Displays the V3 engine version
installed in a detected agent system.
- Last Manual Scan: Displays the last date for
the V3 manual scan run in an agent system.
Process ()
Click the Process icon in the tree process to display the information
for the detected Process in the right side of the page. You can run a command
for Terminate Process to respond to a detected
process.
- Respond:
Runs a command to terminate a process, search for a file or collect
a file based on the detected process information.
- Terminate
Process: Terminates a detected process. Click Terminate Process to
run a command for terminating a process.
- Process Name: Displays a detected process name.
- Process ID: Displays a detected process ID (PID).
- File Path: Displays a detected process path.
- Hash value: Displays a hash value of a detected
process.
- Detection Time: Displays the time when a process
was detected.
 Note
Note
To view the command status
for file search and file
collection, select Search for
File or Collect File under
Response.
File ()
Click the Process icon in the process tree to display the information
for the detected file in the right side of the page. Run a command for
Search for File or Collect
File to respond
to a detected file. Click the icon () next to a file name to move to
Detection > File.
- Respond:
Searches for or collects a file based on the detected file information.
- Search
for File: Searches for a file
using the detected
file information. Files
can be searched
using domain/group, agent or IP range.
The file search results are displayed in Respond
> Search for File.
- Collect
File: Runs a command to collect a file. Click Collect File and
then a message saying
”Do you want to collect the selected file?” will appear. Click
Yes
to run a command to collect a file to an agent system. The command
results for collecting a file are displayed in Respond
> Collect File.
- File Name: Displays a detected file name.
- Hash Value (MD5): Displays the MD hash value
for a detected file.
- File Size (bytes): Displays a detected file
size. The fie size unit is bytes.
- File Path: Displays a detected file path.
- Detection Time: Displays the time when a file
was detected.
Network ()
Click the network icon in the process tree to display the information
for the detected the network in the right side of the page. No response
is available in the network information,
- Host Address: Displays a host address accessing
the network.
- IP Address: Displays an IP address accessing
the network.
- Port No.: Displays an IP address accessing the
network.
- URL: Displays an URL information accessing the
network.
Registry ()
Click the Registry icon in the process tree to display the information
for the detected registry in the right side of the page. No response is
available in the registry information,
- Key Name: Displays an accessed registry key.
- Value: Displays a value name under an accessed
registry key.
- Data: Displays data shown under an accessed
registry key.
Details
You can view the detailed information about the detected behaviors.
The detailed information shows default information,
detailed behaviors and IOC detection information.
Default Information
Displays the default information such as malicious property or hash
value.
- Name: Displays a malicious code name.
- Diagnosis: Displays a detected item is malicious
or not. If the detected item is determined to be malicious or suspicious,
the diagnosis result will be shown to be Malicious
or Suspicious.
- Hash value: Displays a file hash value
Behavior Information
Displays the detailed behavior information about the individual detection.
The following information shows the details about process execution and
suspicious behaviors. Click  next to the detailed behavior information to select the required information
such as View in order of occurrence, View in recent
action order or View by behavior type.
next to the detailed behavior information to select the required information
such as View in order of occurrence, View in recent
action order or View by behavior type.
Refer to Detection Behavior
for detection details.
- View
in recent action order: Displays a detected behavior in time order.
- View
in recent action order Displays a detected behavior from the most
recently occurred one.
- View
by behavior type: Displays by categorized behavior type.
- Total: Displays the
all behaviors about file/registry/network.
- Process: Displays a behavior only about a process.
- File: Displays a behavior only about a file.
- Registry: Displays a behavior only about a
registry.
- Network: Displays a behavior only about a network.
- Common: Displays the common behavior Information.
- Occurred Time: Displays the behavior occurred
time. (ex: 2019-04-16 10:32:23)
- Type: Categorizes file/process/registry/network.
Note
Depending on a behavior type, the information displayed
in [Process Information] and [Target]
may differ.
- [Process Information]
- File Name: Displays a file name related to
the detected behavior.
- Process ID: Displays a process ID related to
the detected behavior.
- Hash value: Displays a file hash value related
to the detected behavior. The hash value identifies the file information.
- File Path: Displays a file path related to
the detected behavior.
- File Size (bytes): Displays a file size related
to the detected behavior.
- [Target]
- File Name: Displays a file name, which a file
or a process accesses.
- Hash value: Displays a file hash value.
- Process ID: Displays a process ID of a file.
- File Path: Displays a file path.
- Cmd line: Indicates a command required to run
a file.
- File Size (bytes): Displays a file size.
- Remote IP Address: Displays a IP address, which
a file or a process remotely accesses.
- Remote Port No.: Displays a port, which a file
or a process remotely accesses.
- Local IP Address: Displays a local IP address,
which a file or a process remotely accesses.
- Local Port No.: Displays a local port, which
a file or a process remotely accesses.
- Host Address: Displays a host address for network
connection.
- IP Address: Displays an IP address used when
a behavior such as connecting the network occurs.
- Port No.: Displays a port number used when
a behavior such as connecting the network occurs.
- URL: Displays a URL used when a behavior such
as connecting the network occurs.
IOC Detection Information:
Displays the detections made by IOC detection rules uploaded. To make
a detection using IOC, the IOC files should be uploaded from IOC.
- Detected IOC Type: Displays the IOC rule information,
which detects a behavior. Upload the IOC files in the STIX format
to detect a behavior.
- Description: Displays the detailed about detected
IOC. Displays the all behaviors about file/registry/network.
Note
STIX is compatible for the IOC file format. STIX 1.2 supports
file, address object type and URL object type.
- Expand Right: Expands the tree from left to
right.
- Expand Down (Wide): Expands the tree from up
to down.
- Expand Down (Narrow): Expands the tree from
middle to down. The space between the objects is narrow.
Note
You can view the detections for suspicious behaviors in
Detection Behavior.