Summary
Check the abnormal server status, agent status and flagged
agent of the entire domain. You can also check the summary of tasks done
today, created reports and scheduled response.
Summary includes:
- Abnormal Servers and Alert Notifications
- Tasks Done Today ( Created Reports, Advanced
Rule Searches, Scheduled Response)
- Agent Connections
- Flagged Agents
Overview
The Overview bar on top of the page displays statistics for the following
key information. Click on the number to see details.
- Alert Notifications: Displays the number of
total alert notifications generated by each server. If you click the
number, you can check the details of notifications in <Notification
Details>.
- Abnormal Servers: Displays the number of abnormal
servers in the domain. If you click the number, you can check the
details of abnormal server on Domain
status page.
- Tasks Done Today: Displays the total number
of tasks completed today. Tasks include created reports, advanced
rule searches and scheduled response.
- Created Reports: Displays the number of reports
generated today. Click the number to see the detailed information
on the Report status.
- Advanced Rule Searches: Displays the total
number of advanced rule searched today. Click the number to see the
detailed information on the Advanced
Rule page.
- Scheduled Response: Displays the total number
of scheduled responses performed today. Click the number to see the
detailed information on the Response
Schedule page.
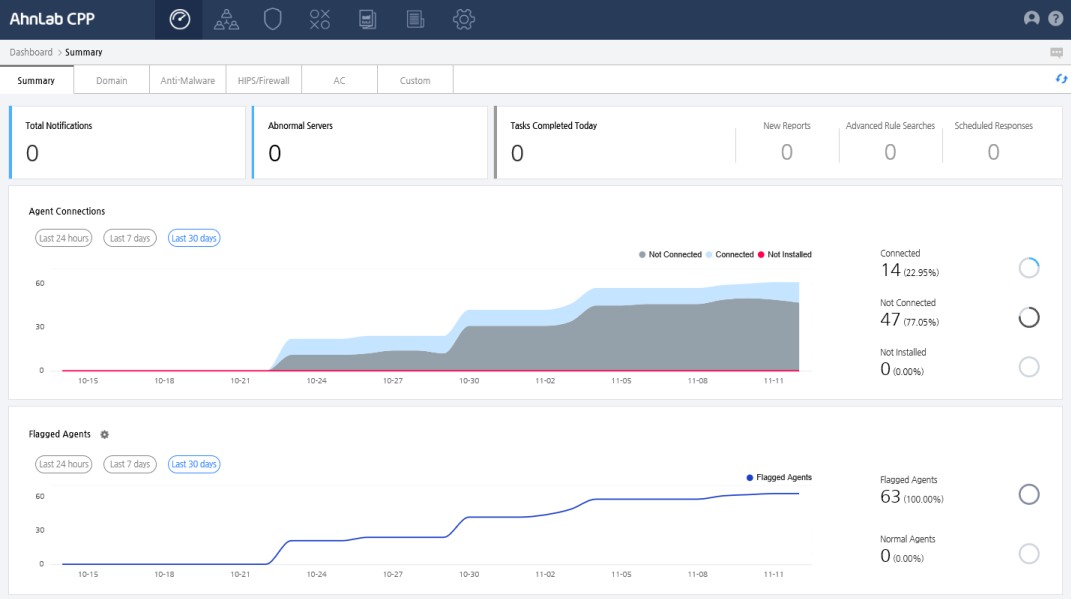
Agent Connections
You can check the graph of the agent's server connections and the number
of vulnerable agents by period. Select a date range to search from the
last 24 hours, last 7 days, or the last 30 days.
- Connected(
 ): Displays the
number of agents connected to the server. Click the number under Connected
to go to agent information part in the Agent Status page to see the
details. The number in parentheses indicates the percentage of agents
connected to the server out of all agents.
): Displays the
number of agents connected to the server. Click the number under Connected
to go to agent information part in the Agent Status page to see the
details. The number in parentheses indicates the percentage of agents
connected to the server out of all agents.
- Not Connected(
 ): Displays
the number of agents that are not connected to the server. Click the
number under Not Connected to go to agent information part in Agent
Status page to see the details. The number in parentheses indicates
the percentage of agents that are not connected to the server out
of all agents.
): Displays
the number of agents that are not connected to the server. Click the
number under Not Connected to go to agent information part in Agent
Status page to see the details. The number in parentheses indicates
the percentage of agents that are not connected to the server out
of all agents.
- Vulnerable(
 ): Displays the
number of agents which is categorized into vulnerable group. Click
the number under Vulnerable to go to the agent information part in
Agent Status page to see the details. The number in parentheses indicates
the percentage of agents that are categorized into vulnerable out
of all targeted agents.
): Displays the
number of agents which is categorized into vulnerable group. Click
the number under Vulnerable to go to the agent information part in
Agent Status page to see the details. The number in parentheses indicates
the percentage of agents that are categorized into vulnerable out
of all targeted agents.
Flagged Agents
You can check the graph of flagged agents by period. Select a date range
to search from the last 24 hours, last 7 days, or the last 30 days. If
you click Settings ( ), you can set the conditions
for agents that have issues on the <Issue Condition Settings> page.
), you can set the conditions
for agents that have issues on the <Issue Condition Settings> page.
- Flagged Agents(
 ): Display
the total number of agents that have issues. Click the number under
Flagged Agents to go to flagged
agents page to check the detailed information. The number in parentheses
indicates the percentage of agents that have issues out of all agents.
): Display
the total number of agents that have issues. Click the number under
Flagged Agents to go to flagged
agents page to check the detailed information. The number in parentheses
indicates the percentage of agents that have issues out of all agents.
- Normal Agents: Display the total number of normal
agents. Click the number under Normal Agents to go to agent status
page to check the detailed information. The number in parentheses
indicates the percentage of normal agents out of all agents.